Direct - 2024-07-30T152345.732

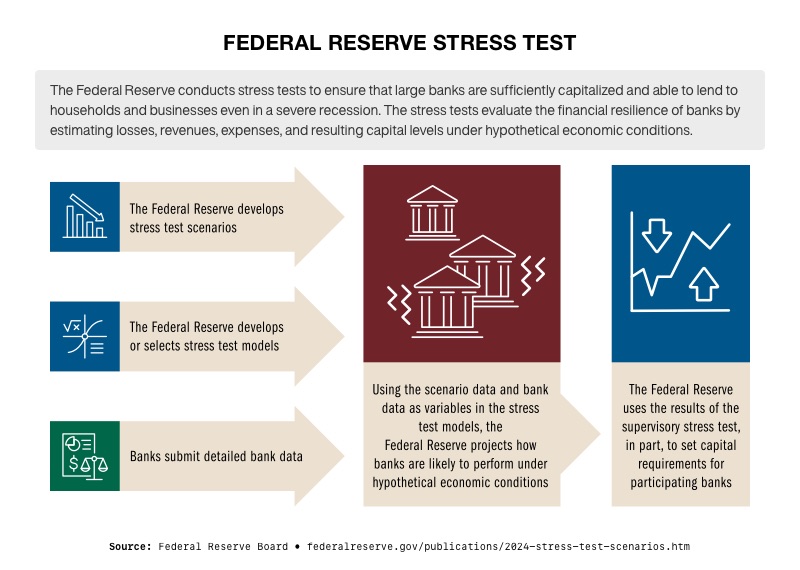
Economists are sounding alarms after several major banks failed the Federal Reserve’s latest stress tests.

Notable institutions such as Citigroup, Bank of America, Goldman Sachs, and JPMorgan Chase fell short in meeting their liquidity requirements. While each bank had unique challenges, the overall results are concerning and raise questions about their ability to withstand financial instability. In today’s economically turbulent times, there is a growing fear that these shortcomings could trigger a broader banking crisis. With banks in China on the brink of collapse, the global banking system finds itself in a precarious position.

The stress test conducted by the Federal Reserve was implemented as part of the post-financial crisis reforms mandated by Congress. The recent test failures have left investors worried about the resilience of these major financial institutions. A significant area of concern is the banks' performance in managing derivatives. As derivatives are a crucial part of the financial landscape, any mismanagement could jeopardize market stability. The 2008 financial crisis, known as the Global Financial Crisis, was largely driven by a collapse in the derivative markets.
Fed Bank Stress Test Chart by the Fed

Goldman Sachs and Other Banks Under Scrutiny

Among the banks, Goldman Sachs was particularly notable for failing the stress test. The Federal Reserve has indicated that its staff collaborates with banks to adjust the tests for accuracy. However, commentators have pointed out that if a bank fails even the adjusted test, it is likely in a troubling financial position. Goldman Sachs currently has the weakest credit performance within its group, and the Federal Reserve’s test predicts a $40 billion loss for Goldman in the event of a severe economic downturn. Even Goldman’s internal stress test forecasts greater trading losses than the Fed’s projections for a hypothetical economic decline. As a result of this failure, Goldman may need to set aside approximately $6 billion to cover potential losses.

Meanwhile, regional banks are also experiencing failures. First Foundation Bank, for example, is struggling due to its commercial real estate holdings. Its shares dropped 24% following news of an unexpected capital requirement of a quarter-billion dollars. First Foundation is one of many smaller banks facing risk because of their exposure to commercial real estate (CRE).

Banking Challenges on a Global Scale

The Chinese banking sector is facing severe challenges. Within a single week, 40 banks vanished, and according to The Economist, about 3,800 Chinese banks are at risk, with assets totaling $6.8 trillion. This figure represents 13% of China's banking system, and experts warn that this could have significant repercussions for the global economy.

The issues facing Chinese banks arise from multiple factors, with a primary cause being the deep recession in China’s real estate market. Developers and local governments burdened with debt are struggling to repay loans, leading to plummeting property prices and stalled construction projects.

Another critical issue is the presence of hidden debts. Chinese banks have been known to offload toxic loans onto management companies, creating an illusion of financial stability. This maneuver removes debt from their books without addressing repayment, contributing to mounting debt burdens in Chinese cities. As the country enters a recession, these banking issues are likely to intensify.

“Years of credit-fueled growth have finally reached their limit, resulting in lower growth for China and a negative impact on the global economy. The slowdown in China’s economy will only worsen their banking problems,” warns Sina_21st.

What This Means for You

An unstable American banking system poses a threat to a critical pillar of retirement savings. As banks manage and invest these funds, instability could lead to diminished returns or losses. Economic uncertainty stemming from banking instability may also adversely affect stock markets, eroding the value of retirement portfolios. Moreover, bank failures could lead to panic-driven withdrawals, further destabilizing financial institutions and deepening economic crises, which could jeopardize retirees’ financial security.

In addition, Chinese bank failures could significantly impact the U.S. economy due to global financial interconnections and China’s economic size. Instability within Chinese banks could trigger market volatility worldwide, affecting U.S. stocks and bonds, and potentially impacting investors and retirement accounts. Furthermore, such failures could disrupt U.S.-China trade, leading to supply chain disruptions and increased prices for Chinese goods. The resulting economic slowdown in China might reduce demand for U.S. exports, harming U.S. businesses and jobs reliant on exports. Financial instability in China could also spread, tightening credit conditions and impacting U.S. financial institutions.

Conclusion

Both domestically and internationally, the banking sector is showing increasing signs of instability. To safeguard their savings against potential bank failures, many Americans are turning to physical precious metals. With no counterparty risk, physical gold and silver in a Gold IRA offer long-term security against a banking crisis. To learn more, contact us toll-free today at 844-977-GOLD
Direct - 2024-07-23T142154.486

Investing in Gold Offers Several Benefits:

  • Protection Against Inflation: Gold has historically maintained its value and purchasing power during inflationary periods, making it a reliable hedge.
  • Safe Haven Asset: During economic downturns or geopolitical instability, gold tends to perform well as investors seek safety.
  • Diversification: Including gold in an investment portfolio can provide diversification, reducing overall risk.

As inflation continues to impact the cost of living, gold remains a prudent choice for those looking to safeguard their financial future.

Ask us for your FREE investors’ guide, it’s full of charts and information revealing gold’s performance in response to the dollar decline in purchasing power, inflation, recessions, and U.S. debt.

Call toll-free at (844) 977-GOLD or Request for Free Guide below.

Harvard Gold Group, HGG

Specializing in Physical Gold & Silver Delivery

 Private Direct Delivery    |    Precious Metals IRA/Retirement Accounts

HGG is America’s #1 Conservative Gold Company, as seen on 660AM The Answer with Mark Davis, The Babylon Bee, Not The Bee, The New York Sun, and more. Exceptional customer service and value are the top priorities of Harvard Gold Group (HGG).

HGG is BBB-accredited, holds 5-star ratings across the board, and provides free consultations and metals overviews. We offer tax-free purchases, free 2-day shipping, the best pricing, and direct access to our co-owners, who have over 15 years of experience specializing in precious metals, moving over a hundred million dollars into tangible assets for people's IRAs/retirement accounts and for direct delivery. Customers enjoy lifetime account care and a straightforward buyback program without hassle or liquidation fees. 

You can move almost any type of retirement account into a physical precious metals IRA. Retirement accounts like IRAs, 401Ks, Pension Funds, TSPs, 403Bs, Inherited accounts, and more. Harvard Gold Group offers 100% free rollovers. Qualify for up to 10 years. Qualifying purchases can also receive up to $15,000 in free metals match, delivered to your door or location of your choice.

Following years of hard work, the last concern you want to worry about is the risk of not being diversified. At Harvard Gold Group, we’re here to answer all your questions with no pressure. We make it easy to buy and easy to sell.

Get your FREE gold & silver investment guide today by filling out the request form below or call us toll-free at (844) 977-GOLD.  Learn more at harvardgoldgroup.com

Copy of Mark Davis Landing Page Photos (2)

Protect Yourself Against These Events by Hedging with Gold & Silver

Request a FREE Investment Guide Today

Your Name(Required)
This field is for validation purposes and should be left unchanged.

All submissions agree to terms and conditions + privacy policy. Unsubscribe anytime.

Article by Harvard Gold Group
Direct - 2024-07-25T154837.912

Elon Musk, "America is going bankrupt btw."  Warns of America's Looming Bankruptcy Due to Its Addiction to Over Spending

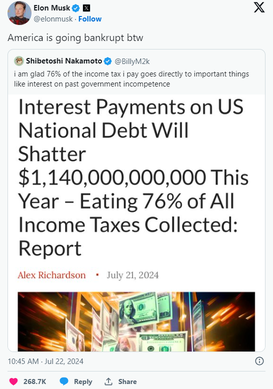
The issue of America's rising national debt has caught the attention of Tesla CEO Elon Musk. In a recent post on the social media platform X, Musk issued a stark warning: "America is going bankrupt btw." This statement was in response to a post by Billy Markus, the creator of Dogecoin.

Markus had shared a headline that read, "Interest Payments on US National Debt Will Shatter $1,140,000,000,000 This Year – Eating 76% of All Income Taxes Collected: Report." Musk expressed his frustration by adding, "I am glad 76% of the income tax I pay goes directly to important things like interest on past government incompetence."

Screenshot_2024-07-25_155454_resized

Understanding the Severity of the Situation

The headline Markus posted originated from an article on The Daily Hodl, which included an analysis by economist E.J. Antoni. Antoni, a research fellow in the Heritage Foundation's Grover M. Hermann Center for the Federal Budget, analyzed the latest Monthly Treasury Statement from the Bureau of the Fiscal Service.

He highlighted that in June 2024, the U.S. government spent $140.238 billion on interest for Treasury debt securities, while collecting $184.910 billion in individual income taxes that same month. This indicates that 76% of June's individual income tax revenue was allocated solely to interest payments on the national debt, excluding principal repayment.

Antoni voiced his concerns about America's fiscal challenge on X, writing, "Interest on the federal debt was equal to 76% of all personal income taxes collected in June - that's the Treasury's largest source of revenue and three-quarters of it gets consumed just by interest; does Congress know? Do they even care?”

Financial Realities

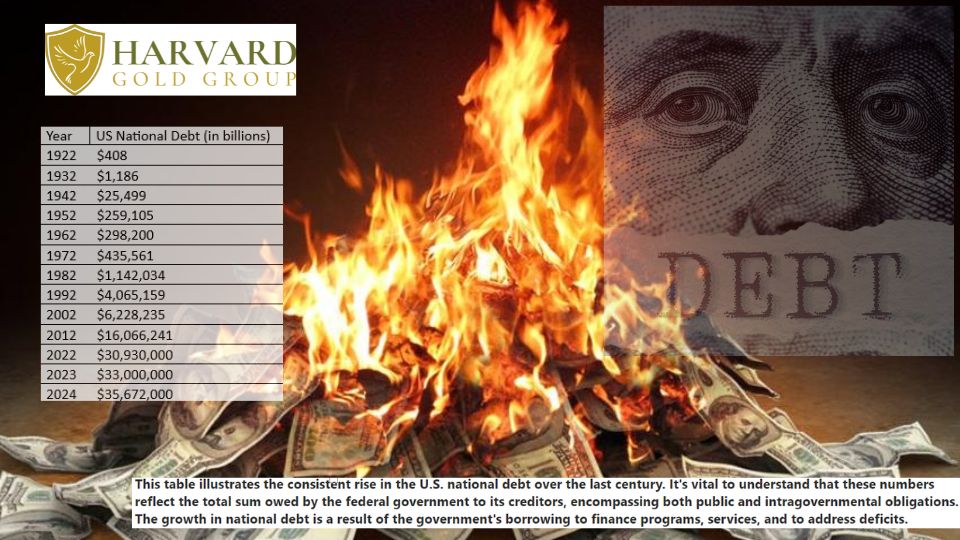
Despite America's strong and expanding economy, its national debt has been growing at an alarming rate. To put this into perspective, the U.S. federal government debt stood at $5.77 trillion at the start of 2000. This figure more than doubled to $12.77 trillion by the beginning of 2010 and escalated to $23.22 trillion at the start of 2020. The latest figures from the Treasury Department show that the national debt has now reached $34.94 trillion.

This rapid increase in debt has led to soaring interest payments, exacerbated by the Federal Reserve's significant interest rate hikes since March 2022. As a result, interest costs are mounting.

Preparing for Dollar Collapse

Understanding and then preparing for the inevitable dollar collapse may be the most important step an individual and family can take. Physical gold and silver have served as ‘back-up’ currency and as a store of wealth against currency crises and collapses for thousands of years. Join the thousands of people who have protected their wealth and generational wealth, with gold.

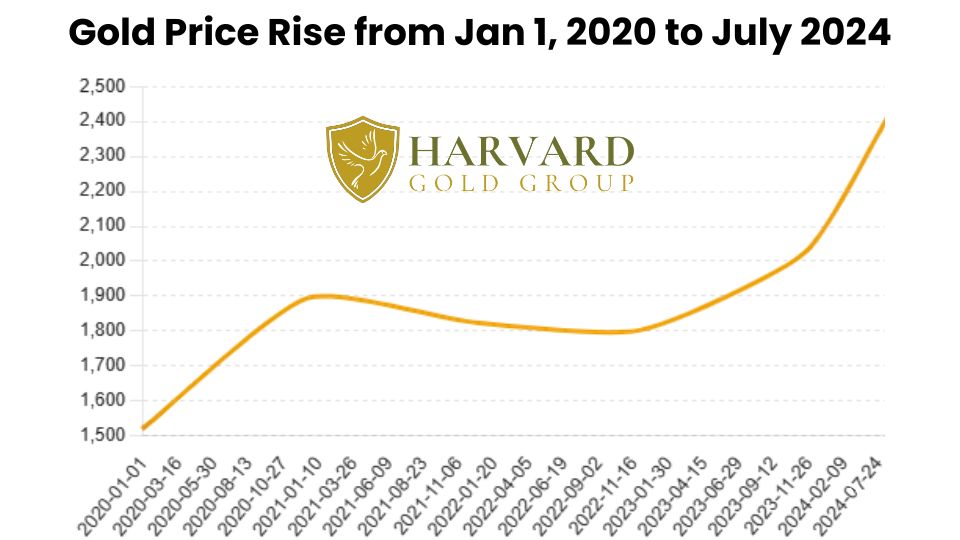
Gold has risen 57.9% since Jan 1st, 2020.

The price of gold on January 1st, 2020 was $1,520 per ounce. The price of gold on July 24th, 2024 was over $2,400 per ounce.

Direct - 2024-07-23T142154.486

Investing in Gold Offers Several Benefits:

  • Protection Against Inflation: Gold has historically maintained its value and purchasing power during inflationary periods, making it a reliable hedge.
  • Safe Haven Asset: During economic downturns or geopolitical instability, gold tends to perform well as investors seek safety.
  • Diversification: Including gold in an investment portfolio can provide diversification, reducing overall risk.

As inflation continues to impact the cost of living, gold remains a prudent choice for those looking to safeguard their financial future.

Ask us for your FREE investors’ guide, it’s full of charts and information revealing gold’s performance in response to the dollar decline in purchasing power, inflation, recessions, and U.S. debt.

Call toll-free at (844) 977-GOLD or Request for Free Guide below.

Harvard Gold Group, HGG

Specializing in Physical Gold & Silver Delivery

 Private Direct Delivery    |    Precious Metals IRA/Retirement Accounts

HGG is America’s #1 Conservative Gold Company, as seen on 660AM The Answer with Mark Davis, The Babylon Bee, Not The Bee, The New York Sun, and more. Exceptional customer service and value are the top priorities of Harvard Gold Group (HGG).

HGG is BBB-accredited, holds 5-star ratings across the board, and provides free consultations and metals overviews. We offer tax-free purchases, free 2-day shipping, the best pricing, and direct access to our co-owners, who have over 15 years of experience specializing in precious metals, moving over a hundred million dollars into tangible assets for people's IRAs/retirement accounts and for direct delivery. Customers enjoy lifetime account care and a straightforward buyback program without hassle or liquidation fees. 

You can move almost any type of retirement account into a physical precious metals IRA. Retirement accounts like IRAs, 401Ks, Pension Funds, TSPs, 403Bs, Inherited accounts, and more. Harvard Gold Group offers 100% free rollovers. Qualify for up to 10 years. Qualifying purchases can also receive up to $15,000 in free metals match, delivered to your door or location of your choice.

Following years of hard work, the last concern you want to worry about is the risk of not being diversified. At Harvard Gold Group, we’re here to answer all your questions with no pressure. We make it easy to buy and easy to sell.

Get your FREE gold & silver investment guide today by filling out the request form below or call us toll-free at (844) 977-GOLD.  Learn more at harvardgoldgroup.com

Copy of Mark Davis Landing Page Photos (2)

Protect Yourself Against These Events by Hedging with Gold & Silver

*We Respect Your Privacy & Do Not Sell Your Information*

Your Name(Required)
This field is for validation purposes and should be left unchanged.

Article by Harvard Gold Group
Source: U.S. Bureau of Labor Statistics
Source: Dec 30, 2023: https://www.resumebuilder.com/due-to-inflation-1-in-5-retirees-likely-to-go-back-to-work-this-year/

Direct - 2024-07-23T133450.756

Treasury Secretary Janet Yellen has brushed aside concerns about 'sticker shock' in American grocery stores, even though food prices have surged by 25% since before the COVID-19 pandemic.

During a June interview with Yahoo Finance senior reporter Jennifer Schonberger, Yellen was asked if she had noticed the price hikes while grocery shopping. Yellen confirmed she shops weekly but did not agree with the notion of 'sticker shock.'

Schonberger highlighted the discrepancy between decreasing global shipping and food commodity costs and persistently high grocery prices. Yellen acknowledged the situation, attributing the price hikes to increased costs, including labor, faced by grocery stores. She also mentioned that there might be some increase in profit margins.

Recent inflation data from the Bureau of Labor Statistics shows a 1.1% rise in average food prices at home over the past year, with a 0.1% increase from the previous month. Prices for four of the six major grocery categories also went up, including a 2.4% rise in butter and margarine, a 0.6% rise in dairy products, and a 0.2% increase in meats, poultry, fish, and eggs.

Despite the 25% increase in food prices from pre-COVID levels noted by Schonberger, Yellen believes grocery executives are aware of the burden on American households. She mentioned meeting with CEOs, including Target's Brian Cornell, who have acknowledged the struggle and announced price cuts on essential items like bread, milk, and diapers.

Yellen does not see the need for further government intervention to address food prices. When asked about increasing agricultural investment to enhance food supply, she expressed reluctance to support more subsidies for agriculture.

Gold as a Hedge Against Inflation and a Safe Haven Asset

In light of the rising cost of living and inflation, many investors are turning to gold as a reliable hedge. Historically, gold has been viewed as a safe haven asset, particularly during times of economic uncertainty and inflation.

The performance of gold over the past few years underscores its value as a protective investment. On January 1, 2020, the price of gold closed at $1,519.50 per ounce. Today, it has reached $2,411.20 per ounce, marking an impressive increase of nearly 59%. This significant rise in gold prices contrasts sharply with the 25% increase in food prices since pre-COVID, demonstrating gold's ability to preserve wealth and purchasing power.

Direct - 2024-07-23T142154.486

Investing in Gold Offers Several Benefits:

  • Protection Against Inflation: Gold has historically maintained its value and purchasing power during inflationary periods, making it a reliable hedge.
  • Safe Haven Asset: During economic downturns or geopolitical instability, gold tends to perform well as investors seek safety.
  • Diversification: Including gold in an investment portfolio can provide diversification, reducing overall risk.

As inflation continues to impact the cost of living, gold remains a prudent choice for those looking to safeguard their financial future.

Why should you expect Gold to continue to Climb higher?

Gold is up over 750% over the past 25 Years

Gold's enduring status as a timeless store of value has remained steadfast throughout the centuries, with its allure undiminished. Widely regarded as the premier asset worldwide, its value steadily climbs year after year. Serving as a reliable hedge against economic uncertainties and inflation, gold stands tall as a cherished haven for investors, making it one of the most coveted investments in global markets.

Now, let's rewind 25 years and delve into the performance of gold prices over the past quarter-century. For investors with a long-term perspective, gold has consistently delivered substantial returns. In this piece, we'll examine the profits generated by gold investments from 1999 to 2024.

Profits in Gold Between 1999 to July 2024

gold chart 01-01 1999 to Apirl 18 2023

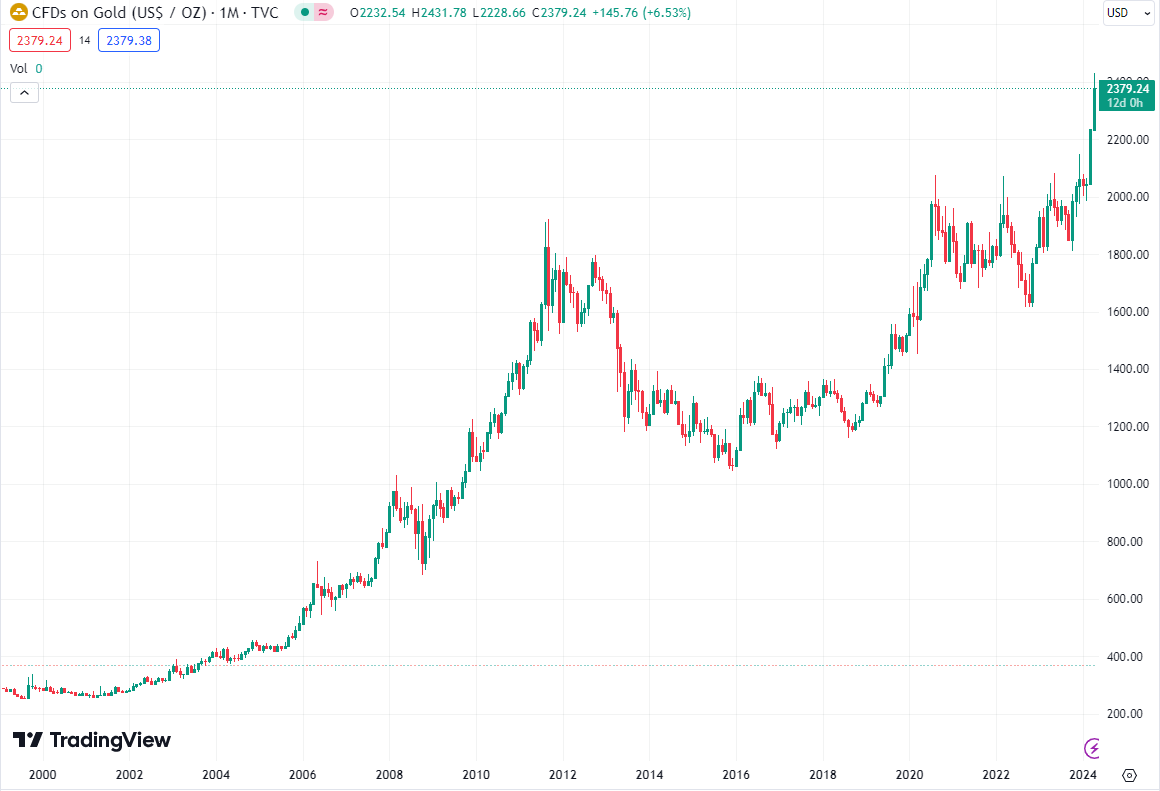
In 1999, the average price of gold stood at $278 per ounce, rebounding from its historical low of $252 earlier that year. Fast forward to this week, and gold prices have surged past the $2,400 mark, fueling robust bullish sentiment. From July 11th, 2024, profits in gold range from $278 to $2,400 per ounce.

Imagine investing $10,000 in gold back in 1999 at an average price of $278 per ounce. With that investment, you could have accumulated approximately 36 ounces of gold. Fast forward to 2024, where gold prices now hover above $2,400 per ounce. That initial $10,000 investment could have blossomed into a remarkable $76,328 in profits.

This translates to an impressive return on investment (ROI) of approximately 763% from 1999 to 2024. To put it into perspective, the average compound annual growth rate (CAGR) of this investment is approximately 10.36%, reaffirming gold's status as a lucrative investment choice.

Harvard Gold Group, HGG

Specializing in Physical Gold & Silver Delivery

 Private Direct Delivery    |    Precious Metals IRA/Retirement Accounts

HGG is America’s #1 Conservative Gold Company, as seen on 660AM The Answer with Mark Davis, The Babylon Bee, Not The Bee, The New York Sun, and more. Exceptional customer service and value are the top priorities of Harvard Gold Group (HGG).

HGG is BBB-accredited, holds 5-star ratings across the board, and provides free consultations and metals overviews. We offer tax-free purchases, free 2-day shipping, the best pricing, and direct access to our co-owners, who have over 15 years of experience specializing in precious metals, moving over a hundred million dollars into tangible assets for people's IRAs/retirement accounts and for direct delivery. Customers enjoy lifetime account care and a straightforward buyback program without hassle or liquidation fees. 

You can move almost any type of retirement account into a physical precious metals IRA. Retirement accounts like IRAs, 401Ks, Pension Funds, TSPs, 403Bs, Inherited accounts, and more. Harvard Gold Group offers 100% free rollovers. Qualify for up to 10 years. Qualifying purchases can also receive up to $15,000 in free metals match, delivered to your door or location of your choice.

Following years of hard work, the last concern you want to worry about is the risk of not being diversified. At Harvard Gold Group, we’re here to answer all your questions with no pressure. We make it easy to buy and easy to sell.

Get your FREE gold & silver investment guide today by filling out the request form below or call us today @ (844) 977-GOLD.  Learn more at harvardgoldgroup.com

Copy of Mark Davis Landing Page Photos (2)

Protect Yourself Against These Events by Hedging with Gold & Silver

*We Respect Your Privacy & Do Not Sell Your Information*

Your Name(Required)
This field is for validation purposes and should be left unchanged.

Article by Harvard Gold Group
Source: U.S. Bureau of Labor Statistics
Source: Dec 30, 2023: https://www.resumebuilder.com/due-to-inflation-1-in-5-retirees-likely-to-go-back-to-work-this-year/

Direct - 2024-07-23T122723.935
  • Over Biden’s near-four years in office, inflation is up roughly 20%. Under Trump, inflation was up 8%.
  • Even adjusting for Bidenflation, deficits have been at least 50% higher under Biden than Trump. 
  • Only a Ph.D. in economics who teaches at an Ivy League school would believe that these Biden policies will bring inflation and interest rates DOWN.

A new Wall Street Journal poll of academic and Wall Street economists finds that most believe that President Biden would do a better job holding down inflation, the debt, and interest rates than former President Trump.

This is a patently ridiculous conclusion that says more about the state of economics than it does about Trump or Biden. It reminds me of the old saying that if all the economists in the world were laid end to end… it would be a good thing.

We know these predictions are suspect because both Biden and Trump have actual records on inflation in their first terms. So we don’t have to throw darts at a dart board blindfolded as these economists apparently are doing. We can examine what happened while they were president.

On each one of these three measures, Trump’s achievements aren’t just a little better. They are FAR superior to Biden’s.

Let’s start with inflation. Over Biden’s near-four years in office, inflation is up roughly 20%. Under Trump, inflation was up 8%. So how could anyone argue that Biden will be better on inflation given that his rate is nearly three times HIGHER than Trump’s. This would be like saying a batter who has struck out four times in a row is more likely to hit a home run than a batter who has hit three homers in his last four at bats.

By the way, Biden did NOT inherit inflation from Trump. In his last four months in office the inflation rate was

Oct. 20—1.2%
Nov. 20—1.3%
Dec. 20—1.5%
Jan. 21—1.4%

Then, 18 months later, under Biden, it was 9.1%.

Now let’s look at interest rates. The mortgage interest rate was 2.9% when Trump left office. The mortgage interest rate is now roughly 7%. That’s more than twice as high. 

The higher interest rates and the inflation in rents and housing prices mean that the mortgage payment on a median value home is now TWICE as high under Biden as under Trump.

How about the interest rate on federal borrowing? During Trump’s last year in office, the 10-year Treasury bill was 0.9%. After three and a half years of Biden, the interest rate is at 4.3%. 

Finally, there is the issue of the federal deficits and debt. Neither president has a good record on controlling spending and borrowing. That’s because both parties like to spend money and play Santa Claus. The question is which president had a worse record?

When we take out the two COVID years, 2020 and 2021, we find that the average deficits under Trump were roughly $750 billion. That’s bad. But under Biden, the average deficit was $1.5 trillion. Even adjusting for Bidenflation, deficits have been at least 50% higher under Biden than Trump. 

But let’s put aside the real world record of Trump and Biden and look at their policy proposals. Trump wants to make the tax rate reductions permanent, continue to deregulate the economy, and encourage greater production of U.S. energy. 

All of these policies are DISinflationary. They will make America more competitive in the world economy, bring capital to the United States, keep the dollar strong, and increase the production of goods and services.

Biden wants to raise tax rates on American businesses, increase regulations, and continue to waste hundreds of billions of dollars on low-return green energy programs while curtailing U.S. production of oil, gas and coal. 

Only a Ph.D. in economics who teaches at an Ivy League school would believe that these Biden policies will bring inflation and interest rates DOWN. They need to take a history class.

When Jimmy Carter endorsed high tax rates, more regulation, and green energy policies, the inflation rate went to above 10%. When Reagan came into office and cut tax rates, deregulated, and went all in for American energy, the inflation rate fell by half.

Biden also points to the 16 Nobel Prize-winning economists who say he will be better on taming inflation than Trump. These are the very same economists who assured us when Biden proposed trillions of dollars of new spending that these policies would NOT cause inflation.

Maybe these economists should simply send back their Ph.D.s and their Nobel medals and admit that they have no idea what they are talking about.

Stephen Moore is a Senior Visiting Fellow in Economics at The Heritage Foundation.

Story by Stephen Moore - Redacted shorter to keep to important points and bullet points added by HGG https://www.heritage.org/debt/commentary/trumps-record-far-superior-bidens-debt-and-inflation

Protect Yourself Against These Events by Hedging with Gold & Silver

Direct - 2024-07-11T131540.426
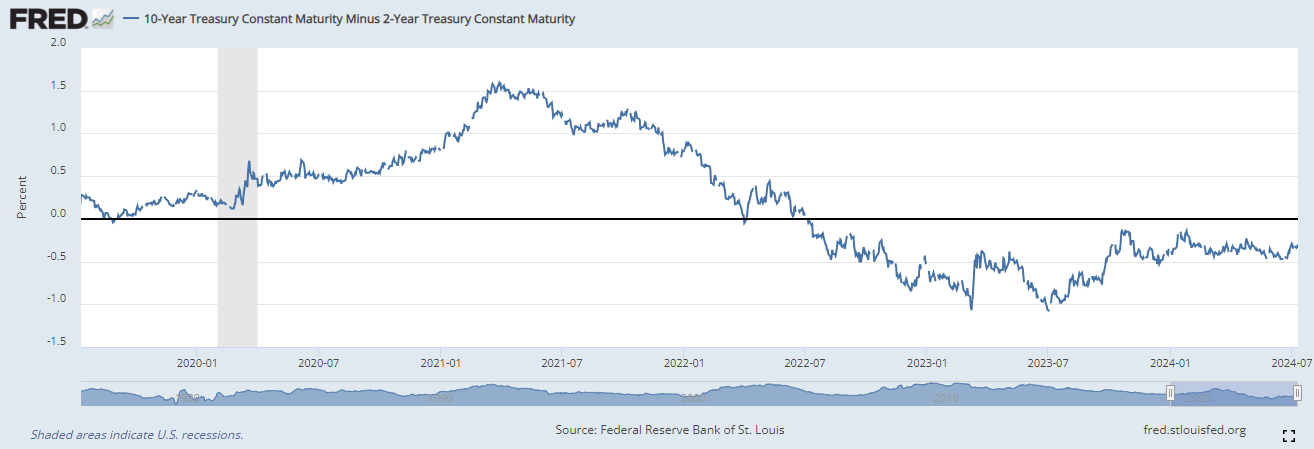
  • An inverted Treasury yield curve has historically been associated with economic downturns, preceding every recession since the late 1960s.
  • Earlier this year, it set a new record for remaining inverted for more than 624 days, which was the 1978 record.
  • The Wizards of Global Finance themselves like European Central Bank President Christine Lagarde are warning against assuming a “soft landing” is anything but assured for the global economy.
  • The yield curve hasn’t remained this inverted overall since the Great Depression.

An inverted Treasury yield curve has historically been associated with economic downturns, preceding every recession since the late 1960s. Earlier this year, it set a new record for remaining inverted for more than 624 days, which was the 1978 record.

The curve has inched slightly back up but remains stubbornly inverted, and now even the Wizards of Global Finance themselves like European Central Bank President Christine Lagarde are warning against assuming a “soft landing” is anything but assured for the global economy. In fact, a crash is feeling more likely by the day.

10-Year Treasury Constant Maturity Minus 2-Year Treasury Constant Maturity

Screenshot 2024-07-11 131241

The yield curve hasn’t remained this inverted overall since the Great Depression. Recessions reliably follow this trend, but pundits are saying that this time it’s different, because it doesn’t signal a contraction in credit as it has in the past, and stocks have rallied since the inversion began. They also say that markets have become more aware of the yield curve and priced it in, reacting with cutbacks before the “real” recession sets in and forces more pain.

With a massive wave of commercial mortgage loans set to mature between 2024-2025, and record numbers of empty office buildings in American cities with little hope of finding occupants, there are at least $1.2 trillion dollars worth of reasons to be concerned.

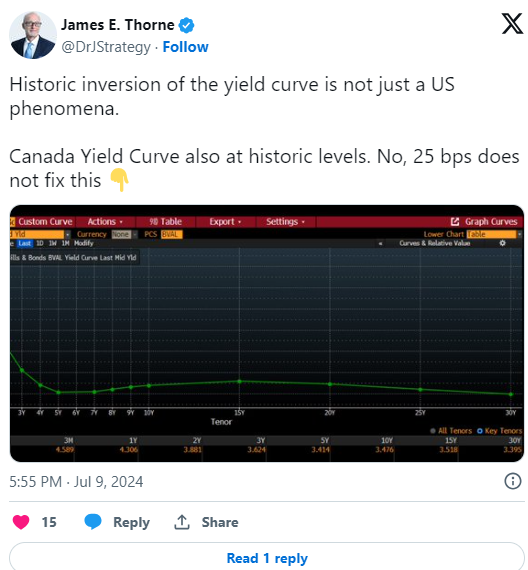
It’s not just the US, either. The yield curve on Canadian bonds has been inverted as well, with persistent inflationary pressures remaining despite Canada’s central bank recently making the decision to cut rates. In the UK, the yield curve just recently flattened out after being inverted for over a year.

Screenshot 2024-07-11 131331

Unsurprisingly, Jerome Powell just ruled out a summer rate cut, citing “modest progress” on inflation. “Higher for longer” monetary policy won’t be enough to bring prices back down, but the Fed will defy expectations if it still doesn’t cut at its FOMC meeting in the fall since industries like commercial real estate and, by extension, banking itself, can’t handle elevated interest rates without imploding under the pressure of even a slightly elevated cost of borrowing. Rate cuts will then make inflation worse as the dollar tanks.

The yield curve ticked up after Trump debated with Biden, which shook up the 2024 race and fueled expectations that a Trump win was possible, leading to higher demand for yield on long-term bonds. That’s because investors expect larger fiscal deficits from a theoretical Trump administration, with anticipated tax cuts and spending increases.

Still, the spin masters of finance always have a fresh set of mental gymnastics to explain away the horrors and hubris of central planning. The inverted yield curve, and still no official recession? It must be that central planners and markets have become so wise that the yield curve no longer means anything. But just wait a little bit longer, and then we’ll see if the pattern ultimately holds.

Meanwhile, central banks and governments do everything they can to paint a rosy economic picture, hoping their words can override reality. As Peter Schiff recently said about cooked economic reports like CPI and the recent jobs numbers:

“The real statistics— if we measured the economy the way we did prior to 1994— you can see why so many people are so miserable.”

Story by Peter Schiff - Redacted shorter to keep to important points and bullet points added by HGG https://schiffgold.com/commentaries/the-yield-curve-christine-lagarde-agree-dont-expect-a-soft-landing/ 

Protect Yourself Against These Events by Hedging with Gold & Silver

Direct - 2024-07-15T144050.494
  • Her concern is how best to protect the international status of the US dollar as US financial sanctions have pushed more countries to seek alternative financial transaction methods that do not involve the US.
  • China and other countries are actively promoting local currency settlements and multilateral cooperation, offering more choices and possibilities for the global financial order.
  • There has been an accelerating trend of de-dollarization over recent years, driven by the US wielding its financial sanctions.

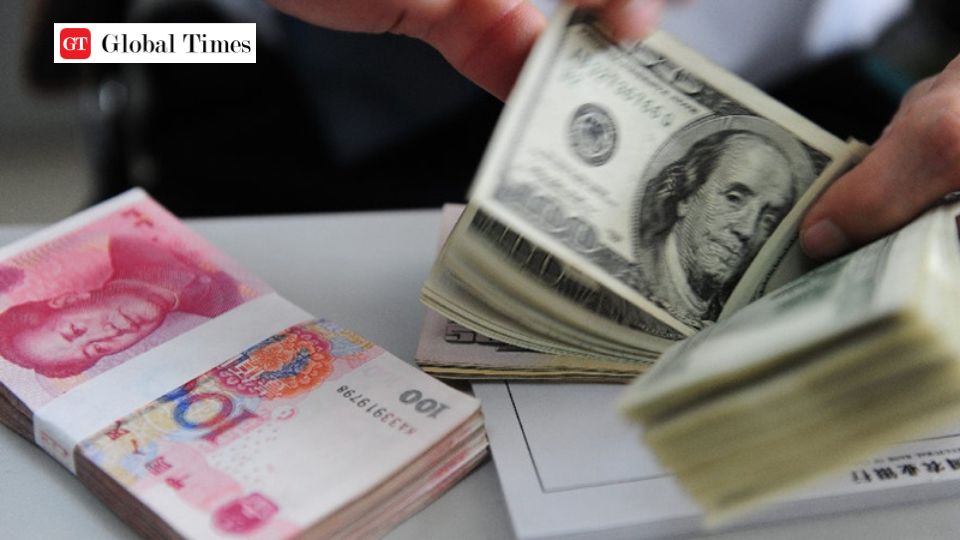
When US Treasury Secretary Janet Yellen on Tuesday testified before the House Financial Services Committee, she said that one of her concerns is how best to protect the international status of the US dollar as US financial sanctions have pushed more countries to seek alternative financial transaction methods that do not involve the US dollar, VOA reported.

The remarks from Yellen have shed light on growing concerns regarding US dollar hegemony. Experts believe that the weaponization of the US dollar will reduce its dominance as the world moves toward local currency settlements and accelerate policies to facilitate de-dollarization. China and other countries are actively promoting local currency settlements and multilateral cooperation, offering more choices and possibilities for the global financial order.

In her testimony before the Committee on Financial Services in the US House of Representatives, Yellen said that the more sanctions the US impose, the more countries will seek financial transaction methods that do not involve the US dollar, VOA reported.

For a long time, the US has abused its dollar hegemony, shifting domestic crises and harvesting global wealth by damaging the economic and financial stability and well-being of other countries. It is also used as a tool to impose financial sanctions, isolating other countries from the dollar payment system.

There has been an accelerating trend of de-dollarization over recent years, driven by the US wielding its financial sanctions, leading some countries to be unable to settle in dollars and prompting them to seek alternatives, Zhao Qingming, a Beijing-based veteran financial expert, told the Global Times on Wednesday.

"This will have a certain impact on the international status of the US dollar. In the short term, the position of the US dollar should remain stable, but over time, its position may weaken," Zhao said.

The dollar hegemony has led to other countries exploring the path of de-dollarization through diversification of currency reserves, establishing local currency settlement mechanisms, and strengthening international cooperation.

China's participation in this movement has been not only to meet the needs linked to the internationalization of the yuan, but also to provide more diversified choices for the world, Zhao said.

In June, Saudi Arabia joined a central bank digital currency initiative for international trade, which may set the stage for wider local currency payments for oil trade between China and Saudi Arabia and reduce the reliance on the US dollar.

In April, the Maldivian Minister of Economic Development and Trade Mohamed Saeed confirmed that Maldivians would soon have the option to settle their import payments using Chinese yuan to meet the government's objective to diversify its settling currency from the US dollar, Xinhua News Agency reported.

A report from Society for Worldwide Interbank Financial Telecommunication showed that in May, the Chinese yuan maintained its position as the fourth most active currency in global payments by value for a seventh consecutive month with a share of 4.47 percent.

Story by Global TImes - Redacted shorter to keep to important points and bullet points added by HGG https://www.globaltimes.cn/page/202407/1315779.shtml 

Protect Yourself Against These Events by Hedging with Gold & Silver

Direct - 2024-04-17T064822.249
  • Silver can and will hit $50 an Ounce.
  • If silver trades above its secular breakout level of $28.80 by August 19th, 2024, silver might reach $50 still in 2024.
  • This article provides insights into the conditions for silver to hit $50. In sum, we expect the big silver run to start in 2024 and move to $50 in two phases, reaching either late 2024 or mid-2025.

Silver can and will hit $50 an Ounce, the only question is WHEN. If silver trades above its secular breakout level $28.80 by August 19th, 2024, silver might reach $50 still in 2024.

This article provides insights into the conditions for silver to hit $50. In sum, we do expect the big silver run to start in 2024 and move to $50 in two phases which will be reached either late 2024 or mid-2025.

  1. The first target area is $34.70 – $37.70.
  2. The second target area is $48 – $50.

The quest to predict the timing of a price rally is a common intellectual challenge among investors seeking to better understand the silver market. Particularly, silver potential rally to $50 has captured attention due to its implications for traders and long-term investors alike.

Can the silver price hit $50 an Ounce?

Yes, the silver price rally can hit $50 an Ounce.

It was hard to believe when silver was trading at $24 which is when we initially published this article in January of 2024.

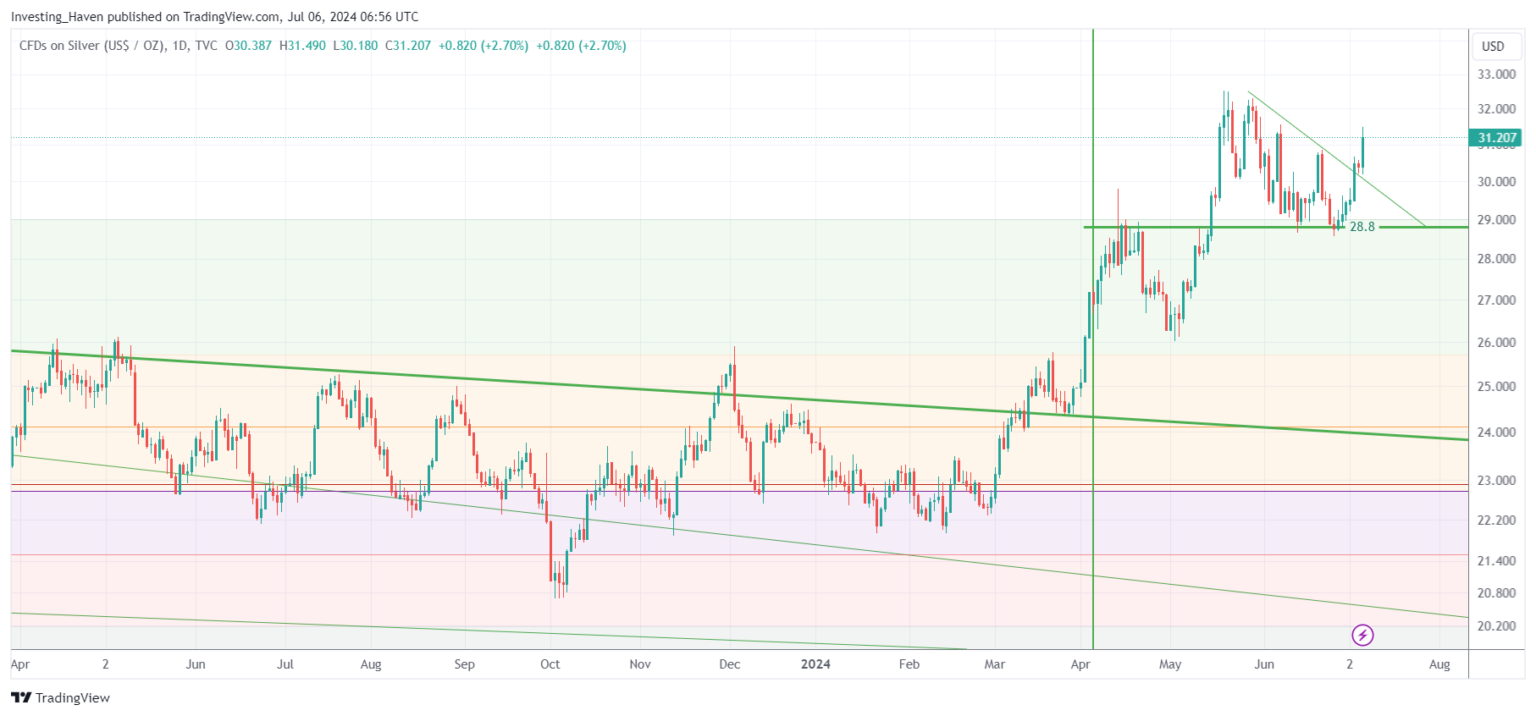
Update on July 14th, 2024 – The silver price, at the time of updating this blog post, is $31/oz. On May 17th, 2024 silver broke out; a few weeks later, it got back down to its breakout level. Since July 3d, 2024, silver confirmed a bounce from its breakout level which is $28.80. Our forecasted $50 target still stands; it might be postponed. We confirm: ‘silver will hit $50 and it will happen in 2024 if silver continues to trade above $28.80 by August 19th, 2024 (without touching $28.80).

Note that silver has a track record of powerful rallies. Consider the 1980 silver rally:

In part due to the actions of the Hunt brothers, the price for silver Good Delivery bars jumped from about $6 per troy ounce to a record high of $49.45 per troy ounce on January 18, 1980, representing an increase of 724%. The highest price of physical silver is hard to determine, but based on the price of common silver coins, it peaked at about $40/oz.

While a silver price rally in which silver will hit $50 may sound like a significant increase, the reality is that it’s neither exceptional nor extraordinary.

Silver breakout confirmed – silver can and will hit $50

May 17th, 2024, is a day for history books – the secular silver breakout happened on that day.

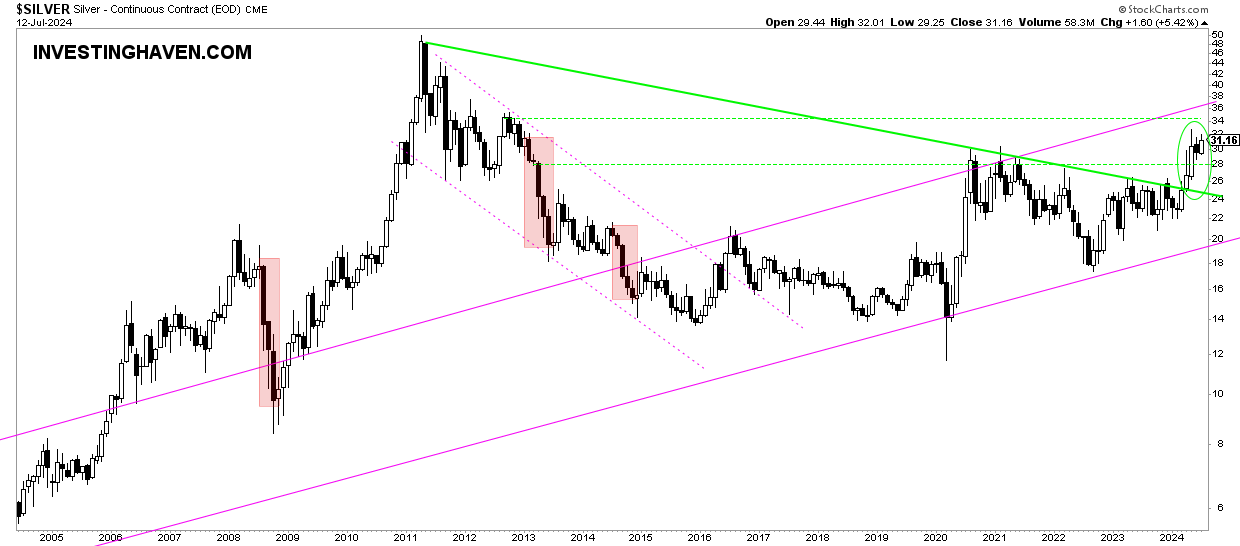
This is one of the must-see charts. The silver breakout on the weekly timeframe.

This is a secular breakout.

And it is powerful.

Silver is clearly headed to $50. The chart pattern will now create a new dynamic, and it will enable silver to hit $50 sooner rather than later.

silver_monthly_price_JULY2024-1536x679

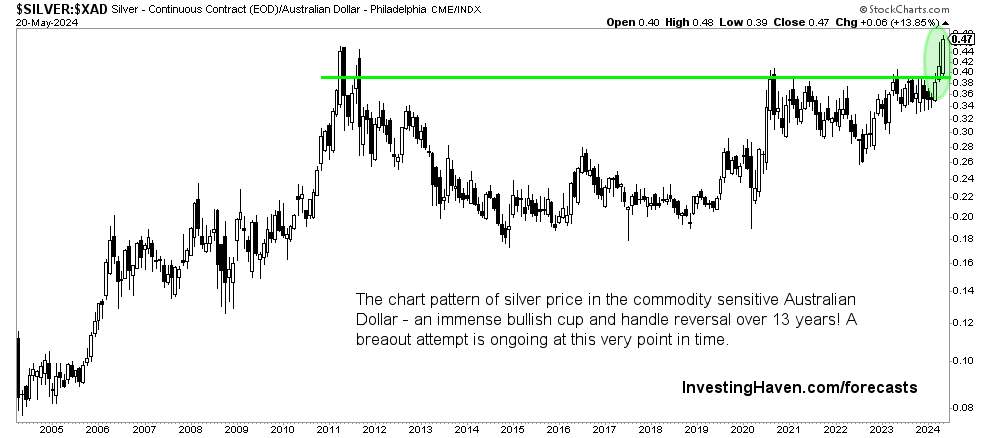
Silver – bull market confirmation by the AUD

The Australian Dollar is objectively confirming that silver can and will hit hit $50 an Ounce.

We explained this in great detail in several premium research notes to our precious metals followers (link to our premium research materials at the bottom of this article) – the Australian Dollar and silver are correlated.

Stated differently, the Australian Dollar has the ability to confirm silver’s bullish intention.

In a recently published article 5 Must-Read Insights For Silver Investors we wrote:

Silver’s bull market was objectively confirmed in the currency market.

It’s important to pay attention to intermarket dynamics. A strong and reliable bull market in any asset or stock is always objectively confirmed in another market.

In the case of silver, we noticed a confirmation in the Australian Dollar (AUD, also Aussie), the most commodity sensitive currency. When the Aussie goes up, it creates (‘confirms’) an environment that is favorable for commodities.

This is how it works:

  • The silver to AUD ratio is an important intermarket measure.
  • The ratio chart structure should be assessed.
  • In case of bullish reversal, it implies that the Aussie is confirming silver’s bull market.
  • The opposite is true as well.

Below is an up to date silver to AUD ratio chart. The chart pattern is ultra bullish. The AUD is objectively confirming the silver breakout. In a way, the AUD is giving green light for silver to hit $50 in the not too distant future.

silver_AUD_bull_market_MAY2024

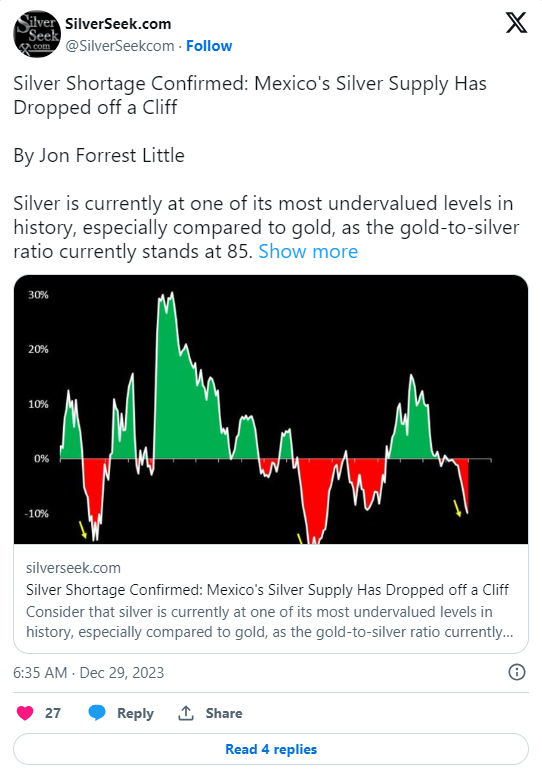
Silver supply shortage

In our analysis silver shortage, we stated:

The looming silver shortage stands out as a ticking time bomb. Despite COMEX silver price setting, the law of supply and demand will eventually prevail. As we approach a true silver supply shortage, the silver market’s true potential awaits, ready to reshape the price setting dynamics and elevate silver to new heights.

Indeed, the silver shortage is developing into a really serious problem. It seems to be getting worse with each passing month, as evidenced by recent data:

Screenshot 2024-07-15 155142

We believe that the physical market ultimately will take over control. Price discovery, orchestrated from within the silver futures market (COMEX) is not a sustainable price discovery dynamic.

Unless this physical silver market supply shortage resolves, which is very unlikely, it seems inevitable that the silver price will hit $50 an Ounce.

Silver COT analysis

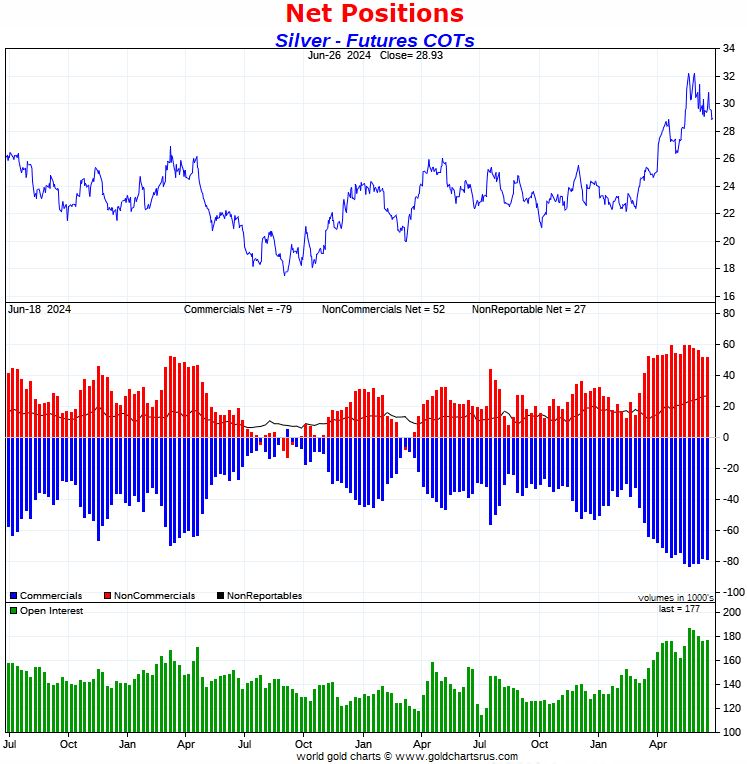
One of the tools at the disposal of traders and analysts is the Commitment of Traders (COT) report, which presents a snapshot of market sentiment based on the positions of different trader categories.

Currently, on May 12th, 2024, the silver COT report paints a bearish-to-neural picture:

  • net positions of commercials and non-commercials are bearish;
  • commercials peaked in April, they are slightly decreasing their net short positions.

This suggests too much interest on the short side in the COMEX silver market. However, the readings are stretched, so some selling is required before silver can move higher. Alternatively, exceptional conditions like war or a supply squeeze can push silver higher, but only under really extreme conditions.

Update on July 14th, 2024 – The ‘really extreme conditions’ mentioned in the previous paragraph may be materializing with the most aggressive invasion of Russia in Ukraine, on May 10th, 2024 (source), combined with the rate cuts outlook (source).

silver_COT_20240629

For a detailed explanation of the mechanics of this chart, we suggest to follow our premium gold & silver market report.

On the flipside, obviously, comes the manipulation thesis. Silver is experiencing a supply deficit, for 3 years in a row, as explained above. How comes the price of silver is more than 50% below its ATH while all other commodities exceeded their 2007/2012 ATH?

Silver chart: the rally to $50 now officially started

Chart analysis often reveals patterns that provide valuable insights into future price movements.

The 12-month consolidation, since May 2023, hints at a bullish chart reversal which, if confirmed, should resolve to the upside in the current or next 3-month cycle (details about cycle analysis are shared every weekend in our premium gold & silver research service).

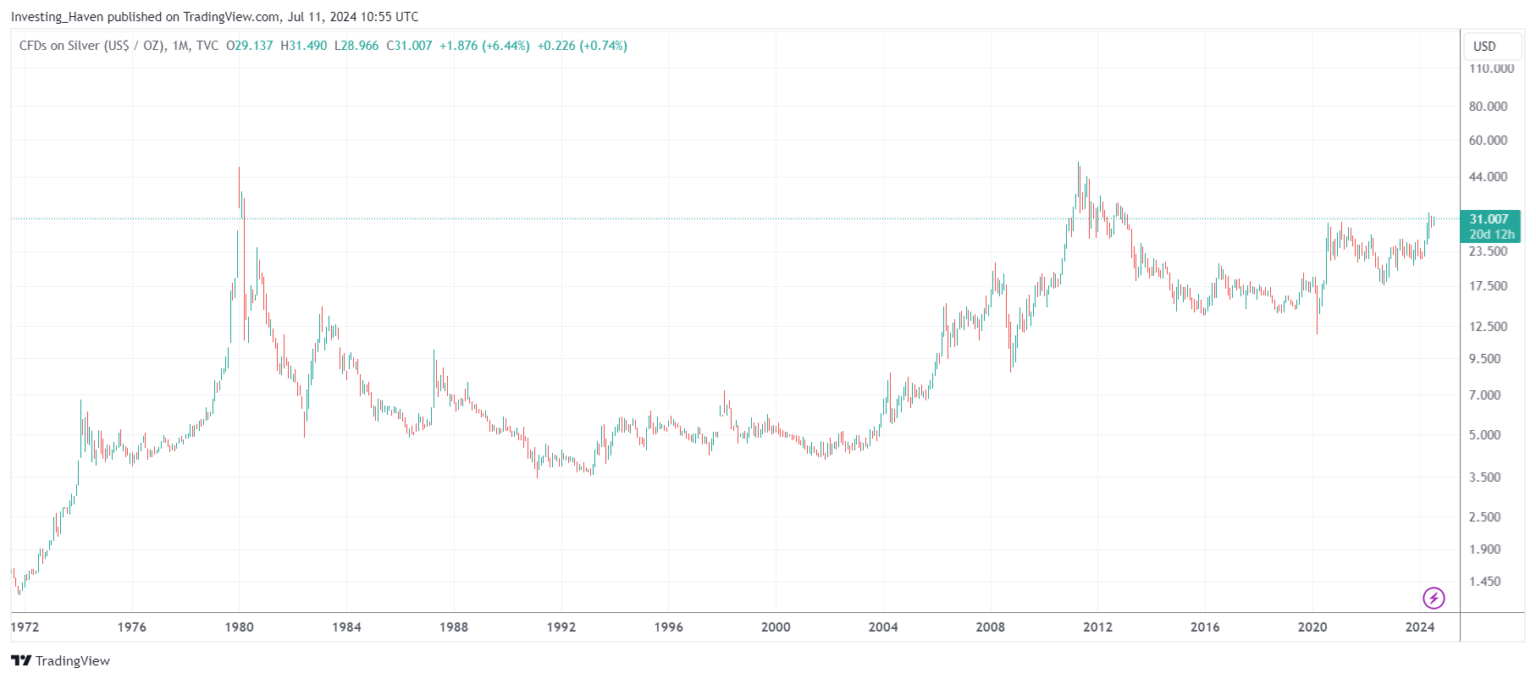
Such patterns are considered significant as they indicate a shift in sentiment from bearish to bullish or vice versa. If the pattern breaks to the upside, it will confirm a secular breakout attempt. This breakout might signify the beginning of a new bullish phase for silver, possibly setting the stage for the anticipated rally. Silver price chart: TradingView.

SILVER_2024-07-06_08-56-55-1536x716

Moreover, the medium term oriented silver chart (above) should be complemented by the secular silver chart (below). As seen below, silver is now testing an epic secular breakout point. The falling trendline since 2011 is being tested for the 7th time in 4 years. This time might be different as the secular pattern nicely aligns with the cycle chart shown above.

silver_price_monthly_chart_JULY_2024

Historical context

Silver’s history is marked by periods of significant price surges driven by various factors. Looking back, the metal has demonstrated its potential to deliver substantial gains within short timeframes. These historical instances underline the notion that silver is capable of sudden and powerful price movements. While history doesn’t repeat itself exactly, it does provide valuable insights into how external factors can propel silver prices higher.

Two stages of the silver price rally to $50 an Ounce

It’s important to understand that predicting a price rally to $50 doesn’t mean a single, uninterrupted climb. The journey could involve two distinct stages.

The initial stage might see silver moving toward $34.70, driven by a combination of technical and fundamental factors.

Once this stage is achieved, the path to $50 could follow. It will be supported by strengthening market sentiment, potential supply-demand imbalances, and external catalysts.

Conclusion

As investors eagerly await silver’s ascent to $50, a nuanced understanding of market dynamics and technical patterns is crucial.

Precise timing remains uncertain. However, a well-rounded perspective can be gained by:

  • monitoring the silver COT report;
  • analyzing price patterns;
  • considering historical context;
  • and acknowledging the potential for a two-stage rally can offer.

By incorporating these insights and analyses, investors can approach the silver market with a more informed outlook.

Story by InvestingHaven.com - Redacted shorter to keep to important points and bullet points added by HGG  https://investinghaven.com/silver/when-price-silver-start-rally-50-usd/ 

Protect Yourself Against These Events by Hedging with Gold & Silver

Direct - 2024-04-18T145523.694

On July 3rd, Citi analysts introduced a model for understanding and predicting gold prices, aiming to revitalize investment in this asset with a comprehensive, regime-independent approach. The model explains annual gold price movements over the past 55 years and quarterly changes over the past 25 years, identifying key price drivers.

Citi's model highlights that investment demand, from both private and public sectors, relative to gold mine supply, is the primary driver of gold prices. Citi reports that in the first quarter of 2024, gold investment demand in China and by central banks rose to 85% of mine supply, averaging over 70% of mine supply in the past two years. This surge has offset the negative effects of higher US real interest rates, pushing gold prices to record highs.

Citi forecasts continued growth in gold investment demand, potentially absorbing almost all mine supply in the next 12-18 months. They predict gold prices will reach $2,700-$3,000 per ounce by 2025, driven by expected US interest rate cuts and increased ETF demand. Continued purchases by Chinese and global central banks, influenced by excess savings, weak property markets, and de-dollarization, will also support this trend.

Several factors could further boost gold investment and outperform other asset classes, such as potential Trump trade tariffs, US fiscal policies, and geopolitical tensions in the Middle East. However, risks to this bullish forecast include weaker-than-expected China retail demand, reduced central bank demand, or delays in Fed interest rate cuts.

Citi's July forecast for gold to reach $2,700 to $3,000 per ounce by 2025 aligns with their April predictions and mirrors the upward revisions made by other major financial institutions on Wall Street. In April, amid escalating tensions in the Middle East and expectations of the Fed lowering interest rates in 2024, Goldman Sachs set a bullish target of $2,700, while Bank of America projected $3,000. UBS went even further, forecasting an impressive $4,000 per ounce—a potential doubling of current values.

Citi analysts Aakash Doshi and Arkady Gevorkyan likened gold to shining bright like a diamond. They adjusted their year-end 2024 price target to $2,350 per ounce, marking a 6.8% increase, and made a substantial 40% upward revision to $2,875 per ounce for 2025. They anticipate that the $3,000 level will be reached after regular testing of $2,500 in the second half of this year.

Citi attributes gold's rise to increased flows from managed money players, who are catching up with demand from physical consumers in China and central banks. They also suggest that a potential Fed cutting cycle or recession scenario heading into 2025 will further boost investment demand.

Deutsche Bank also weighed in, forecasting gold prices at $2,400 per ounce by year-end 2024 and at $2,600 by December 2025. According to their analysts, gold is likely to maintain its strength as new investors replace any profit-taking by early investors.

As of yesterday, July 11th, gold has increased by $358.10 per ounce in 2024, representing a 17.36% increase.

The rally in gold prices can be attributed to a confluence of factors including market concerns over persistent inflation in the U.S., escalating geopolitical conflicts, the approaching U.S. elections raising worries about the country's fiscal situation, and Central Banks buying gold.

Amidst these market dynamics, major Wall Street banks have been notably adjusting their gold price forecasts higher.

Why should you expect Gold to continue to Climb higher?

Gold is up over 750% over the past 25 Years

Gold's enduring status as a timeless store of value has remained steadfast throughout the centuries, with its allure undiminished. Widely regarded as the premier asset worldwide, its value steadily climbs year after year. Serving as a reliable hedge against economic uncertainties and inflation, gold stands tall as a cherished haven for investors, making it one of the most coveted investments in global markets.

Now, let's rewind 25 years and delve into the performance of gold prices over the past quarter-century. For investors with a long-term perspective, gold has consistently delivered substantial returns. In this piece, we'll examine the profits generated by gold investments from 1999 to 2024.

Profits in Gold Between 1999 to July 2024

gold chart 01-01 1999 to Apirl 18 2023

In 1999, the average price of gold stood at $278 per ounce, rebounding from its historical low of $252 earlier that year. Fast forward to this week, and gold prices have surged past the $2,400 mark, fueling robust bullish sentiment. From July 11th, 2024, profits in gold range from $278 to $2,400 per ounce.

Imagine investing $10,000 in gold back in 1999 at an average price of $278 per ounce. With that investment, you could have accumulated approximately 36 ounces of gold. Fast forward to 2024, where gold prices now hover above $2,400 per ounce. That initial $10,000 investment could have blossomed into a remarkable $76,328 in profits.

This translates to an impressive return on investment (ROI) of approximately 763% from 1999 to 2024. To put it into perspective, the average compound annual growth rate (CAGR) of this investment is approximately 10.36%, reaffirming gold's status as a lucrative investment choice.

Harvard Gold Group, HGG

Specializing in Physical Gold & Silver Delivery

 Private Direct Delivery    |    Precious Metals IRA/Retirement Accounts

HGG is America’s #1 Conservative Gold Company, as seen on 660AM The Answer with Mark Davis, The Babylon Bee, Not The Bee, The New York Sun, and more. Exceptional customer service and value are the top priorities of Harvard Gold Group (HGG).

HGG is BBB-accredited, holds 5-star ratings across the board, and provides free consultations and metals overviews. We offer tax-free purchases, free 2-day shipping, the best pricing, and direct access to our co-owners, who have over 15 years of experience specializing in precious metals, moving over a hundred million dollars into tangible assets for people's IRAs/retirement accounts and for direct delivery. Customers enjoy lifetime account care and a straightforward buyback program without hassle or liquidation fees. 

You can move almost any type of retirement account into a physical precious metals IRA. Retirement accounts like IRAs, 401Ks, Pension Funds, TSPs, 403Bs, Inherited accounts, and more. Harvard Gold Group offers 100% free rollovers. Qualify for up to 10 years. Qualifying purchases can also receive up to $15,000 in free metals match, delivered to your door or location of your choice.

Following years of hard work, the last concern you want to worry about is the risk of not being diversified. At Harvard Gold Group, we’re here to answer all your questions with no pressure. We make it easy to buy and easy to sell.

Get your FREE gold & silver investment guide today by filling out the request form below or call us today @ (844) 977-GOLD.  Learn more at harvardgoldgroup.com

Copy of Mark Davis Landing Page Photos (2)

Protect Yourself Against These Events by Hedging with Gold & Silver

*We Respect Your Privacy & Do Not Sell Your Information*

Your Name(Required)
This field is for validation purposes and should be left unchanged.

Article by Harvard Gold Group
Source: U.S. Bureau of Labor Statistics
Source: Dec 30, 2023: https://www.resumebuilder.com/due-to-inflation-1-in-5-retirees-likely-to-go-back-to-work-this-year/

Direct - 2024-07-09T084754.837
  • Citi analysts have introduced a framework for understanding and forecasting gold prices.
  • Central to Citi's framework is the idea that investment demand, from both private and public sectors, as a share of gold mine supply, is the primary driver of gold pricing.
  • Citi forecasts that gold investment demand will continue to rise, potentially absorbing almost all mine supply over the next 12-18 months.
  • This underpins their base case for gold prices to reach $2,700-3,000 per ounce by 2025.

Citi analysts have introduced a framework for understanding and forecasting gold prices, which they state aims to rejuvenate investment in this asset by providing a robust, regime-independent model.

This framework is said to explain annual price movements over the past 55 years and quarterly changes over the past 25 years, highlighting key drivers of gold prices.

Central to Citi's framework is the idea that investment demand, from both private and public sectors, as a share of gold mine supply, is the primary driver of gold pricing.

According to Citi, "Gold investment demand in China and central banks has risen to 85% of mine supply during 1Q’24 and averaged more than 70% of mine supply over the past two years." This surge in investment demand has counteracted the negative impact of higher US real interest rates, pushing gold prices to record highs.

Citi forecasts that gold investment demand will continue to rise, potentially absorbing almost all mine supply over the next 12-18 months.

This underpins their base case for gold prices to reach $2,700-3,000 per ounce by 2025. The expected normalization of US interest rates, with "8 consecutive Fed cuts starting in September," is anticipated to drive higher ETF demand.

Additionally, continued buying by Chinese and global central banks, fueled by factors like excess savings, weak property markets, and de-dollarization, will support this trend.

Several developments could further bolster gold investment and drive outperformance relative to other asset classes, according to the bank.

These include potential Trump trade tariffs, US fiscal policies aimed at inflating away debt, and geopolitical tensions such as conflicts in the Middle East. However, Citi notes that risks to their bullish forecast include weaker-than-expected China retail demand, reduced central bank demand, or delays in Fed interest rate cuts.

Story by Sam Boughedda - Redacted shorter to keep to important points and bullet points added by HGG https://www.investing.com/news/commodities-news/citi-gold-investment-demand-to-rise-3507020 

Protect Yourself Against These Events by Hedging with Gold & Silver

Direct - 2024-07-03T102207.262
  • "There’s a clear path for gold to outperform from here, likely fueled by Western flows.”
  • Year-to-date gold prices are up roughly 12%; the yellow metal is one of the best-performing assets in global financial markets, Artigas said.
  • Artigas noted that gold has been able to withstand these traditional headwinds due to robust retail demand in Asia and record purchases from central banks. However, the market is now looking to Western investors for the next move in the uptrend.
  • Although the gold market currently lacks a catalyst, the WGC noted that ongoing geopolitical uncertainty, the threat of an economic slowdown, and persistently stubborn inflation will continue to create a positive environment for gold.

(Kitco News) -The gold market is waiting for a new catalyst as prices are stuck below $2,350 an ounce. However, investors should not forget what has been accomplished so far this year, according to the latest report from the World Gold Council (WGC).

Although gold could continue to consolidate in the near term, analysts with the WGC see the precious metal well-supported through the second half of the year.

“Gold may remain range-bound if current market expectations prevail,” the analysts said in the report. “However, there’s a clear path for gold to outperform from here, likely fueled by Western flows.”

While gold might be stuck in neutral, Juan Carlos Artigas, Head of Research at the World Gold Council, said in an interview with Kitco News that the current price action doesn’t diminish its accomplishments in the first half of the year.

Year-to-date gold prices are up roughly 12%; the yellow metal is one of the best-performing assets in global financial markets, Artigas said.

Gold has been able to make its gains despite a difficult market, as the Federal Reserve’s aggressive monetary policy has supported higher bond yields and a stronger U.S. dollar.

Artigas noted that gold has been able to withstand these traditional headwinds due to robust retail demand in Asia and record purchases from central banks. However, the market is now looking to Western investors for the next move in the uptrend.

The U.S. central bank has been reluctant to embark on an easing cycle, but it has signaled one potential rate cut by the end of the year. According to the CME FedWatch Tool, markets see a nearly 70% chance of a rate cut in September.

Artigas noted that there are emerging signs that Western investors are starting to take an interest in gold as outflows from gold-backed ETF markets have started to reverse.

“Over the past couple of months, we have started to see inflows into Europe,” he said. “I think it's not a coincidence that it started with the first rate cut by the ECB.”

Although the gold market currently lacks a catalyst, the WGC noted that ongoing geopolitical uncertainty, the threat of an economic slowdown, and persistently stubborn inflation will continue to create a positive environment for gold.

“Political polarization, armed conflicts, and erosion of globalization in favor of nationalism and select alliances fuel economic instability,” the analysts said. “Geopolitical risk is particularly difficult to predict and may come from where it’s least expected. What is true, however, is that gold reacts to geopolitics, adding 2.5% for every 100-point increase in the Geopolitical Risk (GPR) Index. And while part of this effect can be transient, it could also be a trigger for deteriorating financial conditions, which may have a more lasting effect.”

At the same time, the WGC expects that central banks will continue to buy gold through the second half of the year. Artigas said that while central bank demand may not reach the records set in the last two years, they expect it to be above the 10-year trend of 500 tonnes.

“Central banks are well positioned to see a robust year of gold demand,” Artigas said.

“Given that central bank demand is often policy-driven, timing is difficult to ascertain, but our recent central bank survey provides some reassurance: gold reserves managers believe they will retain their positive outlook towards gold,” the WGC said in the report.

Story by Neils Christensen - Redacted shorter to keep to important points and bullet points added by HGG https://www.kitco.com/news/article/2024-07-02/gold-market-well-positioned-second-half-2024-world-gold-council 

Protect Yourself Against These Events by Hedging with Gold & Silver

Scroll to Top