- The most deeply inverted part of the U.S. yield curve is one that hasn’t sent a false signal about the prospects of a U.S. recession in more than a half-century of research.
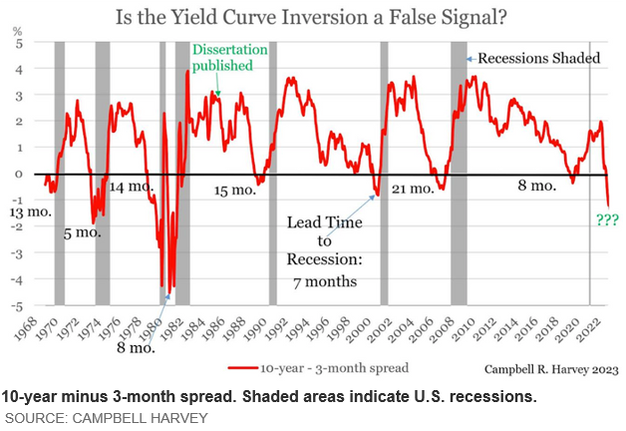
- That’s the spread between 10-year and 3-month Treasury yields, the large difference between the two rates is pointing to the likelihood of a “deep recession,” according to Campbell Harvey.
- The 10-year/3-month spread is further below zero than it was in the run-up to the 2007 -2008 financial crisis and in the late 1980s, when the Federal Reserve pushed interest rates back above 8% to 9%.
The most deeply inverted part of the U.S. yield curve is one that hasn’t sent a false signal about the prospects of a U.S. recession in more than a half-century of research.
That’s the spread between 10-year and 3-month Treasury yields, which was 157.5 basis points below zero on Thursday — reflecting a 3-month T-bill rate TMUBMUSD03M, 4.866% that’s trading well above its 10-year counterpart TMUBMUSD10Y, 3.305%. The large difference between the two rates is pointing to the likelihood of a “deep recession,” according to Campbell Harvey, the Duke University professor who pioneered the use of the spread as an indicator of future economic growth.
Recession fears are back in focus after this week’s data provided fresh evidence that the Federal Reserve’s yearlong rate-hike cycle is finally having an impact on the labor market. With bond-market volatility picking up during the first week of April, liquidity problems and concerns about a potential U.S. debt-ceiling crisis continue to plague Treasuries and exacerbate the market’s moves, according to Tom di Galoma, managing director and co-head of rates trading for financial services firm BTIG. The 10-year/3-month spread is further below zero than it was in the run-up to the 2007 -2008 financial crisis and in the late 1980s, when the Federal Reserve pushed interest rates back above 8% to 9%.

The size of the current 10-year/3-month inversion relative to where yields currently stand “is striking and amounts to a big, serious inversion,” Harvey said via phone on Wednesday. “The magnitude of the inversion can be directly linked to a large slowdown in economic growth, and the model is predicting a deep recession.”
Harvey wrote a 1986 dissertation on the topic of whether interest-rate structures could be used to forecast economic growth and looked at data going back to 1900. He uses 1968 as the starting point for determining the accuracy of the 10y/3m spread’s predictive powers because that was when Treasurys became a highly liquid market.
The 10y/3m spread — which typically provides advance warning of a recession of anywhere from six to 18 months — first fell below zero in October. Initially, Harvey held out hope that the U.S. could avoid a downturn. Last December, he told MarketWatch that the gauge — which hadn’t been inverted long enough at the time to send a definitive statement — might be sending a “false signal” and that the probability of a soft landing was more likely.
That was before the Federal Reserve hiked rates again in February and March, and the banking system increasingly became the channel by which the Treasury-curve inversion played out in public. Now policy makers have “gone too far and are playing with fire,” Harvey said.
The curve is a line that plots the differences in yields across all debt maturities. It typically slopes upward, with investors demanding a premium to compensate for risks that can develop over time. A flatter curve can signal concerns about the economic outlook. An inverted curve, in which short-dated yields rise above longer-dated yields, is a warning sign.
The inversion of the Treasury curve matters for a number of reasons. One of them is that it’s upended the business model used by banks, which make money by lending at higher rates over the longer term than they pay borrowers for their deposits. Analysts said that an inverted yield curve appeared to play a role in the demise of California’s Silicon Valley Bank in March, for example. “I have no idea how many more banks the Fed has put at risk, but I certainly hope they [policy makers] do,” Harvey said.
On Thursday, Treasury yields finished mostly higher as traders await Friday’s nonfarm payrolls report for March. All three major U.S. stock indexes DJIA, 0.01% SPX, 0.36% COMP, 0.76% also ended up.
At Academy Securities in San Diego, David Gagnon, managing director and head of U.S. Treasury trading, said the financial market appears to be weighing two sets of “extreme scenarios.”
“For bonds, there’s a risk that the economy gets caught in a recession,” Gagnon said via phone. “Stocks are not too worried about the Fed having to reverse course in a recession and are instead worried that the economy doesn’t go into recession,” leaving policy makers to keep hiking rates.
A small portion of the inversion in the 10-year/3-month spread is due to technical factors relating to supply imbalances, illiquidity, and worries about the debt ceiling, he said. The rest has to do with the bond market “pricing in the risks of a hard landing and the Fed having to respond aggressively.”
Story by Vivien Lou Chen - Updated: 4/6/2023, First Published: 4/5/2023 Redacted shorter to keep to important points and bullet points added by HGG. https://www.marketwatch.com/story/bond-markets-most-deeply-inverted-gauge-is-pointing-to-large-slowdown-in-economic-growth-and-deep-recession-3c1d21e1


