

Although inflation has eased significantly from the 2021–2022 spike— when it hit 9 percent—it remains somewhat elevated at 2.7 percent today. What matters more, however, is the lingering burden it has placed on American households. A Statista Consumer Insights survey from June–July 2025 found that nearly half of U.S. adults (49%) identified the high cost of living as their biggest challenge, far outweighing other concerns.
A common misunderstanding is that prices fall once inflation slows. In reality, the damage is lasting: once costs rise, they tend to stay there. Data from the Bureau of Labor Statistics shows that overall consumer prices have climbed 22.7 percent since January 2021. Certain necessities have surged even higher—food up 25 percent, rents up nearly 27 percent, and transportation up 28 percent. Meanwhile, wages have only risen 21.8 percent in the same span, meaning paychecks have not kept pace with expenses. For many families, that leaves them in a weaker position financially than they were almost five years ago.
Real Inflation
Since 1971—when Nixon shocked the world by severing the dollar’s tie to physical gold—the government has repeatedly changed the way they measure inflation for publicly reported statistics. The inflation surge of the 1970s led to revisions in the late ’70s and early ’80s, each adjustment generally lowering reported inflation compared to the original methods. These changes continue to fuel debate: do they improve statistical accuracy, or do they mask the true “felt” inflation experienced by everyday Americans while offering fiscal advantages to the government?
Why It Matters: These changes—core inflation, OER, health insurance adjustments, and others—generally result in lower official inflation rates, saving the government billions by reducing cost-of-living adjustments for Social Security, tax brackets, and other programs. However, they can make inflation measures feel out of touch for people facing rising costs for essentials like food, gas, housing, insurance, and taxes. Alternative estimates, like those from ShadowStats, suggest inflation could be 7–10% higher using original inflation calculation methods, highlighting the gap between official numbers and lived experiences.
At the bottom of this report, you can locate the entire list of removed and or modified components to the inflation calculations since 1970.
Due to inflation, today’s dollar buys about 52% of what it did in 2000.
That’s a 47.64% loss in purchasing power over just this period.
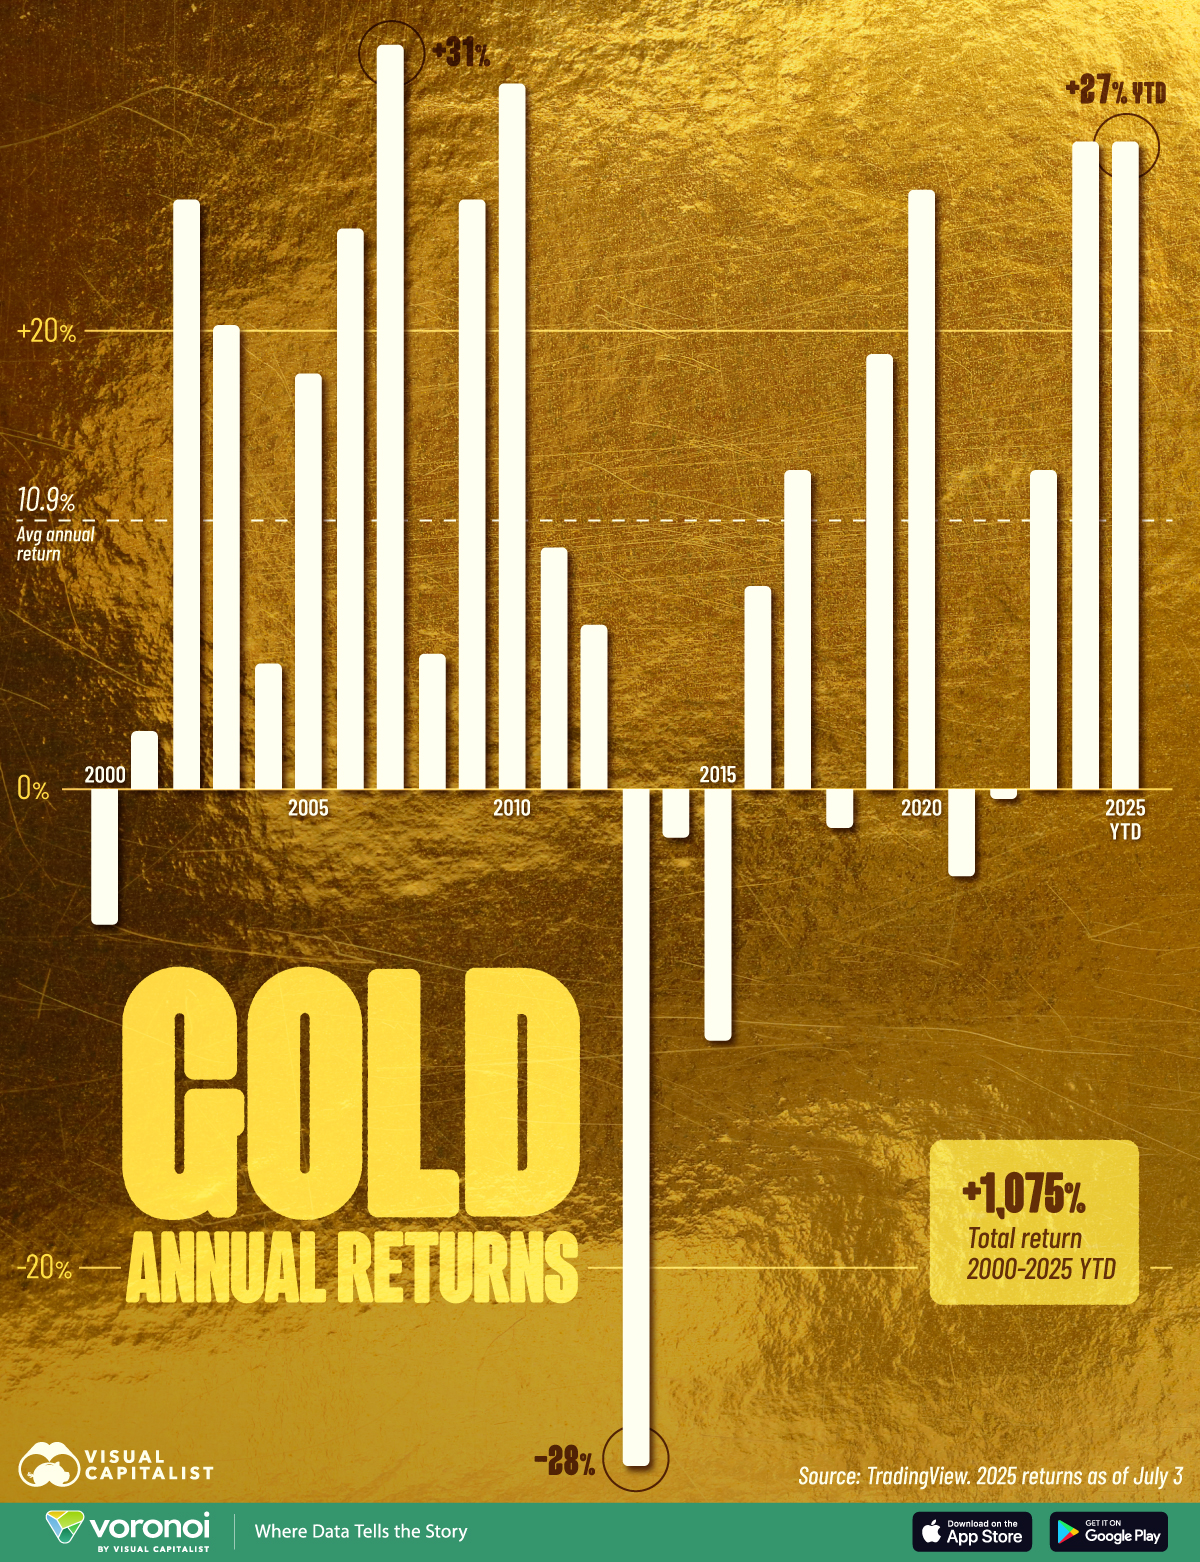
The Best Hedge Against Inflation is Gold
Summary of Components Removed or Modified in U.S. Inflation Calculations Since 1971
Since the 1970s, the U.S. government has adjusted how it measures inflation through the Consumer Price Index (CPI) and Personal Consumption Expenditures (PCE) price index. These changes often reduced reported inflation rates, prompting criticism that they understate the rising costs people actually feel. Below are the key components that were removed or altered in these calculations:
- Food and Energy (Removed from Core Inflation, 1970s–1980s):
- What Changed: The concept of "core" inflation, excluding volatile food and energy prices, was introduced and formalized in the late 1970s/early 1980s. Core CPI and core PCE focus on less fluctuating items to show underlying trends.
- Why: To reduce short-term price swings (e.g., from oil shocks) for policymakers like the Federal Reserve.
- Impact: Core measures often report lower inflation, but since food and gas are major household expenses, this can feel disconnected from daily budgets. For example, in 2022, headline CPI was 8%, while core CPI was closer to 6%.
- Homeownership Costs (Replaced with Owners’ Equivalent Rent, 1983):
- What Changed: The CPI replaced actual homeownership costs—like house prices, mortgage interest, homeowners’ insurance, property taxes, and maintenance—with Owners’ Equivalent Rent (OER), which estimates what homeowners would pay to rent their homes.
- Why: To reduce volatility from home prices and interest rates, which spiked in the 1970s. OER uses rental data, which changes more slowly.
- Impact: This lowered CPI’s sensitivity to housing market swings. Critics argue it understates costs for homeowners, as mortgage payments and insurance premiums aren’t directly counted. For instance, ShadowStats estimates 2023 inflation would be 14% using pre-1983 methods versus the official 5%.
- Health Insurance Costs (Shifted in CPI, Downweighted in PCE, 1990s–2000s):
- What Changed: In the CPI, health insurance costs are now measured indirectly through retained premiums (premiums minus claims paid), reducing their weight. The PCE includes employer-paid health insurance, which dilutes consumer-paid costs since the Fed adopted PCE in 2000.
- Why: To reflect only the consumption portion of insurance and account for broader spending patterns in PCE.
- Impact: This lowers reported inflation, especially since healthcare costs often rise faster than other expenses. For retirees or those paying out-of-pocket, this feels understated.
- Homeowners’ Insurance (De-emphasized in CPI, 1983):
- What Changed: Homeowners’ insurance was removed from the CPI’s shelter component as part of the 1983 OER shift, with only a small indirect weight in the index.
- Why: To focus on consumption (rent-like costs) rather than investment aspects of homeownership.
- Impact: Rising insurance premiums are barely reflected, potentially underreporting costs for homeowners, especially in high-risk areas where premiums have soared.
- Taxes (Removed from CPI, 1983):
- What Changed: Property taxes and other homeownership-related taxes were excluded from the CPI when OER was adopted in 1983. Sales and income taxes are also not directly included in CPI or PCE.
- Why: CPI focuses on out-of-pocket consumer spending, and taxes are treated as separate from consumption costs.
- Impact: This omits a significant household expense, especially as property taxes rise with home values, making inflation feel higher than reported.
- Quality and Substitution Adjustments (1990s–2000s):
- What Changed: Hedonic models (1990s) adjust prices for quality improvements (e.g., better computers), effectively lowering reported price increases. Substitution adjustments, like geometric weighting (1999) and Chained CPI (2002), account for consumers switching to cheaper goods, reducing inflation readings.
- Why: To reflect consumer behavior and technological advancements more accurately.
- Impact: These lower reported inflation (e.g., Chained CPI is 0.2–0.3% lower than CPI-U annually) but may not reflect fixed budgets or the reality for those who can’t easily switch products.